DyingLoveGrape.
A Brief Introduction to Veronoi and Delaunay Diagrams.
Point on a Plane and Closest Regions.
Let's plot a set of points. They can be essentially random for now, but note that this could stand for some kind of real-world data. Here it is:
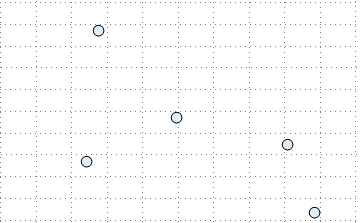
Now let's tell a story. Once upon a time there were five greedy sisters who were given houses built on a countryside. They decided, being greedy, that they wanted to fence in their property. Since they didn't want too much conflict, they agreed that they'd only fence off land that was closest to their particular house (so, Sister 1 would only get a point of land if and only if it was closer to her house than any of the other sisters' houses). Here's the map they made:
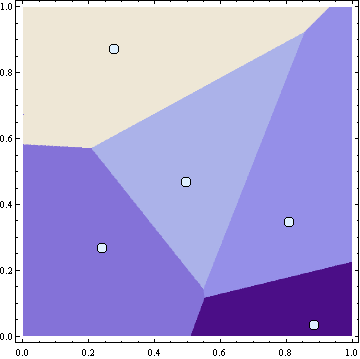
Such a plot is called a Voronoi Diagram; given $n$ points (not necessarily on the plane, but in some space) we partition the space into $n$ pieces, each piece consisting of exactly one of our $n$ points as well as all of the points which are closest to that point. If this is a bit confusing, look back at the picture: the tanpart on the upper-left side is all of the points closest to the upper-left-most point. Notice that when we start going south from that point, there is a divide between the tan part and the blue-purple part in the lower-left: points in the purple part start being closer to the point in the lower-left than the point in the upper-left, so they are in their own little partition with the lower-left point. These little partitions, by the way, are called Voronoi Polygons, and it turns out that they are always convex polygons (or convex polytopes if we are doing such a diagram in higher dimensions).
Looking at a more realistic case, suppose there are 10 power stations scattered around some town, and they want to know (at least approximately) which homes they should power. Suppose, for the problem, that they don't need to worry about how much power, they just want to worry about minimizing loss: they'd like to power the closest houses that they can. This seems like a problem tailor-made for Voronoi diagrams. Let's picture this:
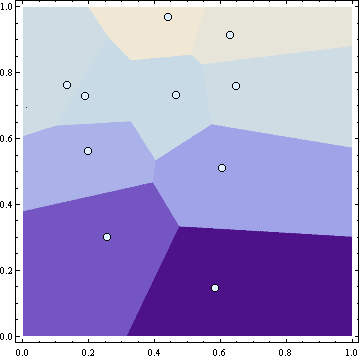
It's a bit difficult to distinguish between some of the blue colors here, but there are exactly ten Voronoi polygons, one containing each point. What this says is, the power plants should zone the city according to this mapping and, for example, if a house falls in one of the power station's Voronoi polygons then it should be powered by that station.
There are too many examples of Voronoi diagrams being useful for me to list. I've seen it be applied to the recreation of virtual tumors from points given by an $x$-ray, looking at nerve pathways, and where to run public transport so that people can more easily trek about a city.
Anecdote. When I found my apartment's blueprints, I tried to look at how to "zone" my apartment in terms of the two bathrooms we have: I found, in particular, that I was closer to the smaller one and my two roommates were closer to the bigger one. Sort of a silly idea, but one can see how to generalize such a problem to things which actually matter.
Graphs and their Duals.
We'll take a brief interlude from Voronoi diagrams to talk a bit about graphs. We'll need this at the end of the post, but since Delaunay triangulations form a graph it's a good time to introduce them. A graph is a collection of vertices and edges which are assembled in a nice way:
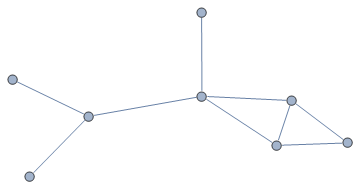
This doesn't look much like our Voronoi diagrams above, which is a bit upsetting, but that's okay; we didn't really expect them to in the first place. Either way, one neat thing we can do to graphs is to take their dual; the way one does this is the following:
- First, put one vertex inside of each closed polygons your graph makes. Also, put one vertex somewhere on the outside of all the closed-in polygons of your graph.
- Second, draw edges between each vertex if their closed polygonal regions were next to each other in the original graph; also, if the region was next to the "outside" of the graph, connect that vertex in the dual to the "outside" vertex.
Congratulations! You've made a dual graph. The idea is sort of like this: points in the dual correspond to closed-in polygons in the original graph. Each edge in the original graph should be crossed once and only once by an edge in the dual.
It's much easier to show a picture of this than to describe it. The blue graph is the original graph, the red graph is the dual.

We will talk about duals in a future post; at times, it is easier to work with a dual than it is to work with the original structure and (generally) if one proves a theorem for an original structure the theorem will also be able to be "dualized".
Delaunay Triangulations.
The Delaunay Triangulation is a strange structure. The idea is like this:
- Take some number of points (let's say, for now, on the plane).
- Now connect the points such that the entire figure is now "made up of" triangles (i.e., triangulate). Look at the picture below for an idea of what this means.
- Pick a triangle and look at its three vertices: draw a circle which contains all these vertices. If none of your original points are inside the cirlce, good: keep going until you've exhausted all of the triangles. If any of the original points are inside of any of the circles then this is not a valid triangulation: go back to the previous step and try again.

The figure above shows all of the circles that we made in this triangulation; note that none of these circles contains, on the inside, any of the other points that we started with. If this is the case, then we call the graph that we've made (the original points and the edges forming the triangles) a Delaunay Triangulation. These structures, in and of themselves, are extremely important in a number of different fields (which we'll go into later), but for now we'll link them up with the Voronoi Diagrams we've just studied.
As you might expect after reading the last section, the Delaunay triangulation is dual to the Voronoi diagram! Check out this figure:

Pretty neat, no? Notice that it is not exactly the dual as we've talked about before. Specifically, first, we are not allowing edges to "curve" and, because of this, we don't require the vertex on the outside of the figure: the edges simply keep extending on forever outwards. Second, we pick the center of the circle passing through the three vertices of a particular triangle to be the vertex which corresponds to that particular triangular face. If you're doing it by hand, the process is like this: look at all the circles you made, plot all of the centers, connect them if their corresponding triangles are next to each other, and if the triangle is adjacent to the "outside" of the whole thing then make an edge extending outwards passing perpendicular through each of the "outside" edges of the original triangule. Check out the picture above if this is a bit confusing to you.
Each partition of the plane these points make is a Voronoi polygon. In the figure above, make sure that you count exactly five Voronoi polygons and, moreover, note that each of our original points is in exactly one of these! Almost like magic.
It's instructive to make an "incorrect" Delaunay triangulation (allowing one of the circles to contain an original point on its interior) and see what goes wrong. Usually, it's the case that more than one original point is in the Voronoi polygon. Note also that it is not always possible to make a Delaunay triangulation: for example, if you have three colinear points it's impossible to create a circle which passes through all of them. There are other criteria which make these triangulations impossible; see if you can find a few!
Last, even if the triangulation exists, it is not usually unique. Drawing a square and attempting to triangulate gives us two different triangulations: the diagonal up-left to bottom-right, and the diagonal bottom-left to up-right. This non-uniqueness might seem strange to you: the Veronoi diagram is unique (one cannot really change things when one is talking about rigid distances) and the dual (up to some rigid translations in this case, perhaps) is unique, and the dual is the Delaunay diagram — which is not necessarily unique. You may want to think about this for a bit. I'll post a hint below.
Think about the square again; look at the centers of the circles that one makes for each different triangulation: the centers will be the same and, hence, will not create any differences when one is constructing the duals. Do any other kinds of ambiguities come up in when making Delaunay triangulations?
Next time...
Next time, we'll look at some applications of Delaunay Triangulations and Voronoi Diagrams.